
THE VELOCITY OF MONEY Or is it?
DEFINITION
Investopedia has a useful and commonly accepted definition:
Thanks for reading! Subscribe for free to receive new posts and support my work.
The velocity of money is the rate at which money is exchanged in an economy. It is commonly measured by the number of times that a unit of currency moves from one entity to another within a given period of time. Simply put, it's the rate at which consumers and businesses in an economy collectively spend money.
The velocity of money is usually measured as a ratio of gross domestic product (GDP) to a country's M1 or M2 money supply. The word velocity is used here to reference the speed at which money changes hands.
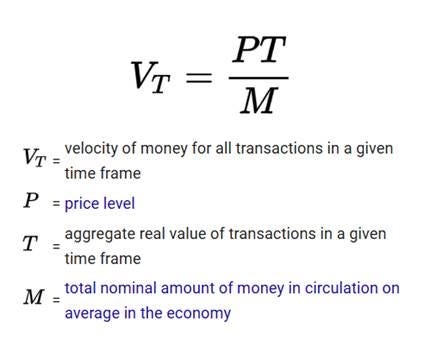
FORMULA
FUNCTIONALITY
That is what the concept means. Then there is the functionality of the concept:
Understanding the Velocity of Money
The velocity of money is important for measuring the rate at which money in circulation is being used for purchasing goods and services. It is used to help economists and investors gauge the health and vitality of an economy. High money velocity is usually associated with a healthy, expanding economy. Low money velocity is usually associated with recessions and contractions.
Economists use the velocity of money to measure the rate at which money is used for goods and services in an economy. While it is not necessarily a key economic indicator, it can be followed alongside other key indicators that help determine economic health like GDP, unemployment, and inflation. GDP and the money supply are the two components of the velocity of money formula.
KLEMENT
Klement has these observations:
First, a little bit of history. Irving Fisher created the wonderful concept of velocity of money through an accounting identity in 1910: P * Y = M * V. I apologise for the formula, but in this basic equation, P is the price level of goods and services in an economy, Y is the economy’s output, M is the monetary base (i.e. how much ‘money’ is in circulation) and V is the velocity of money (i.e. how fast money is changing hands). Originally, the velocity of money was thought to be constant but well, the chart below shows that that assumption doesn’t work out that well in real life.
Velocity of money
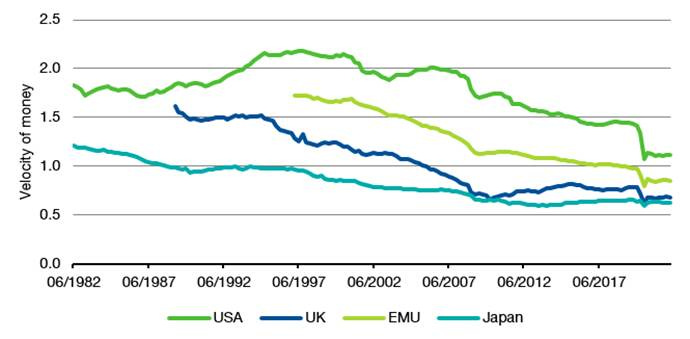
Source: Bloomberg. Note: Velocity of money based on M2
Since the 1980s the velocity of money has been on a secular decline and during the financial crisis and again in the 2020 pandemic it fell off a cliff and never really recovered. There is a lot of speculation what causes this decline in the velocity of money, but the main argument I am making is that the velocity of money is not constant and in fact on a secular decline. Readers of my post last week argue that once this effect is taken into account, the quantity theory of money holds again and an increase in the monetary base leads to higher inflation. Furthermore, some (not all) argue that the velocity of money will rise in coming years triggering a persistent rise in inflation.
My argument is that while the velocity of money is currently very low, I know of no reason why the velocity of money should revert its structural decline over the last 30+ years. In fact, I have written here that monetarist theories of inflation have stopped working more than 30 years ago and trotting out the arguments of Milton Friedman is like trying to ride a dead horse. As a practitioner, I don’t think a theory that has stopped working a generation ago is one I should rely on in my quest to understand the economy. As one of my mentors used to say: “Truth is what works and not what your theory says”.
Some readers have argued (rightfully, I might add) that the growth in the monetary base is not necessarily the right number to compare with inflation. Instead, one needs to compare excess growth in the monetary base above real economic growth with inflation. So, in the chart below, I have done just that and compared broad money growth in the UK minus real GDP growth with inflation. Again, to make long-term trends visible, I have calculated a rolling 10-year average.
Excess growth in monetary base and inflation in the UK
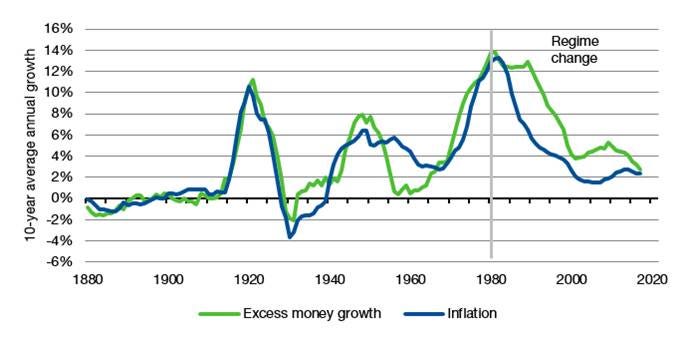
Source: Macrohistory, Bank of England, Bloomberg
The chart shows data for the UK, but the US looks essentially the same. One can clearly see a close link between excess money growth until about the 1970s and a regime change sometime between 1980 and 1990 when the relationship becomes much, much weaker. Coincidentally, or not, this is the time when central banks started to target inflation directly instead of targeting the monetary base and globalisation became a major economic force allowing investors to send their money to wherever they wanted to in the world.
We can zoom in into the last 42 years and switch to quarterly data for that time period. In order to make the comparison as charitable for monetarists as possible, I have reduced excess money growth by 2% per year to take into account the secular decline in the velocity of money and shifted the growth in excess money growth forward by 6 quarters, since Milton Friedman predicted this lag between monetary base growth and inflation. Overall, there is some weak resemblance between the two lines, but deviations are significant and can last a decade or longer. The relationship has been particularly poor since the financial crisis 2008.
Excess growth in monetary base and inflation in the UK
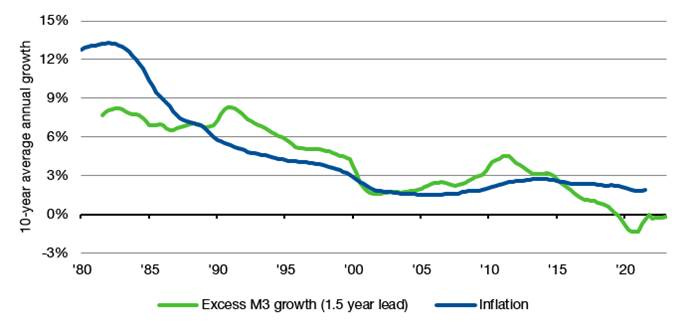
Source: Bank of England, Bloomberg
In summary, my opinion about the quantity theory of money and monetarist theories of inflation is that they are nice models you can read about in your economics textbooks. Economics professors like to teach them because they are intuitive and seem reasonable. But they are of no practical use because in real life these theories are violated so often and so strongly as to make their application useless.
INFLATION
Inflation is always and everywhere a monetary phenomenon, in the sense that it is and can be produced only by a more rapid increase in the quantity of money than in output.” Milton Freidman.
So, the velocity of money plays – in monetary theory - a key role.
MONETARY LOGIC
The essential logical assumptions bear scrutiny.
Take a paradigm case: a collective of cave dwellers. Using some token (Shells) as money. Now, the supply of Shells increases. With no change in the goods and services (quality or quantity) on offer, there is no change in prices: Caveman 1 does not suddenly hand over more Shells to Caveman 2, for whatever Caveman 2 is already supplying.
So, the extra Shells available to Caveman 1 have no economic function. They will simply accumulate in his cave.
The essential logical premise of the entire monetary and velocity theory is invalidated. What is revealed is mistaken attribution of causation to observed correlations: there has tended to be some inflationary aspects of changes in economic behaviour. And changes in money velocity. Neither of the latter is causative of the former. Indeed the correlations themselves are historically weak, and as Klement has shown, have become weaker still in this century.
Monetary phenomena are then at best a refractive index of economic instability.